
How to Read Your Axiom Portfolio
Axiom's Portfolio page keeps two separate records, one for spot tokens and one for perps, so you can see which kind of trading is actually paying. This walks through the spot side panel by panel, then the analysis Portfolio V2 added on top.
 Updated November 18, 2026
On this page
Spot and Perpetuals
Portfolio sits in the top bar. It opens on Spot, with Perpetuals as the second tab, and a 7d, 30d or Max switch sets the period for every number on the page. There is also a search box for looking at another wallet's portfolio the same way, which helps when you want to compare yourself with a wallet you track. Perps get their own article: How to Check Your Perps PnL and Trade History.
Balance, the PnL line and the buckets
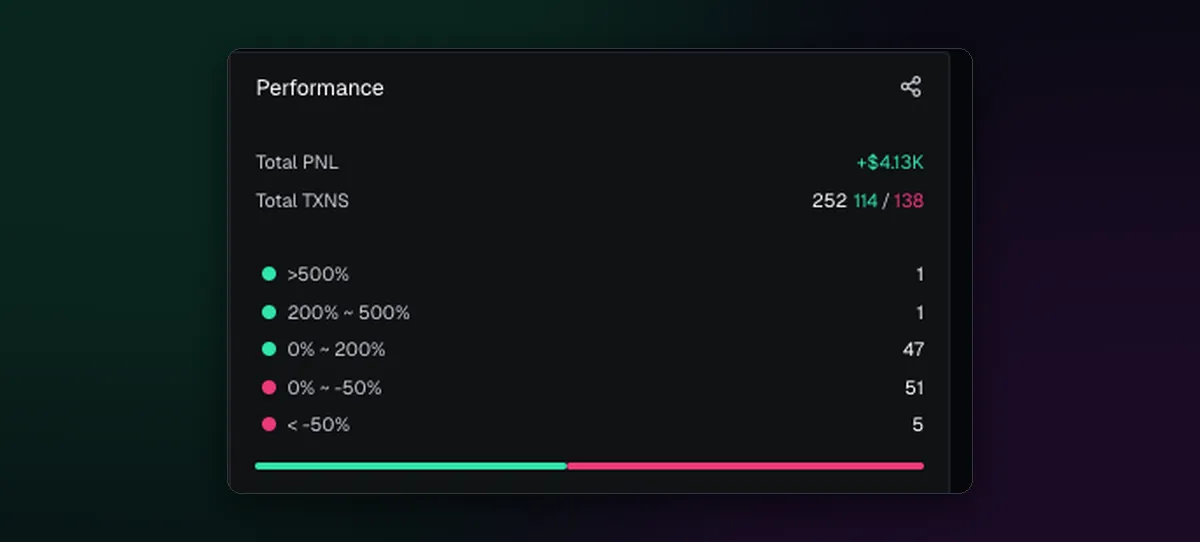
Across the top, Balance shows the total value, the unrealised PnL of what you still hold and the balance free to trade, and the PnL chart beside it draws your result over the chosen period. The Performance panel on the right is the honest part: total PnL, the count of buys and sells, and every closed trade sorted by return, from above 500% down to below minus 50%. If the bottom bucket is fuller than the top two together, the problem is the exits, not the picks.
Active Positions and History
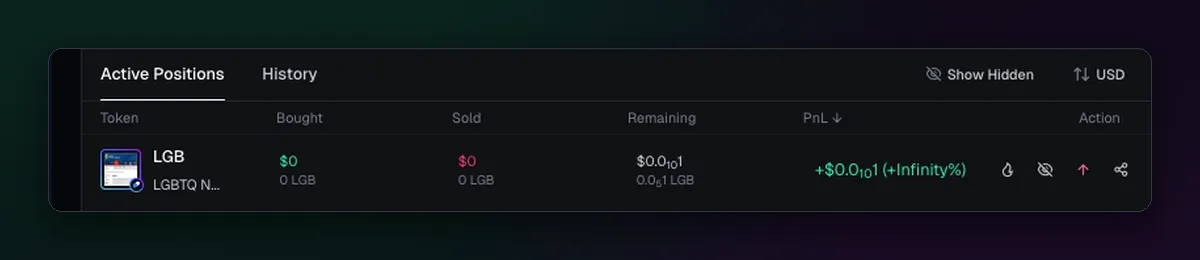
Active Positions lists each token you hold with the amount bought and sold, what remains and its PnL, plus quick actions on the right. History keeps the tokens you have closed out. Tokens you have hidden come back into view with Show Hidden, and the USD switch flips the table between dollars and the chain's coin. The Activity list beside it logs every buy and sell, which How to Look Up a Past Trade on Solscan uses.
What Portfolio V2 adds
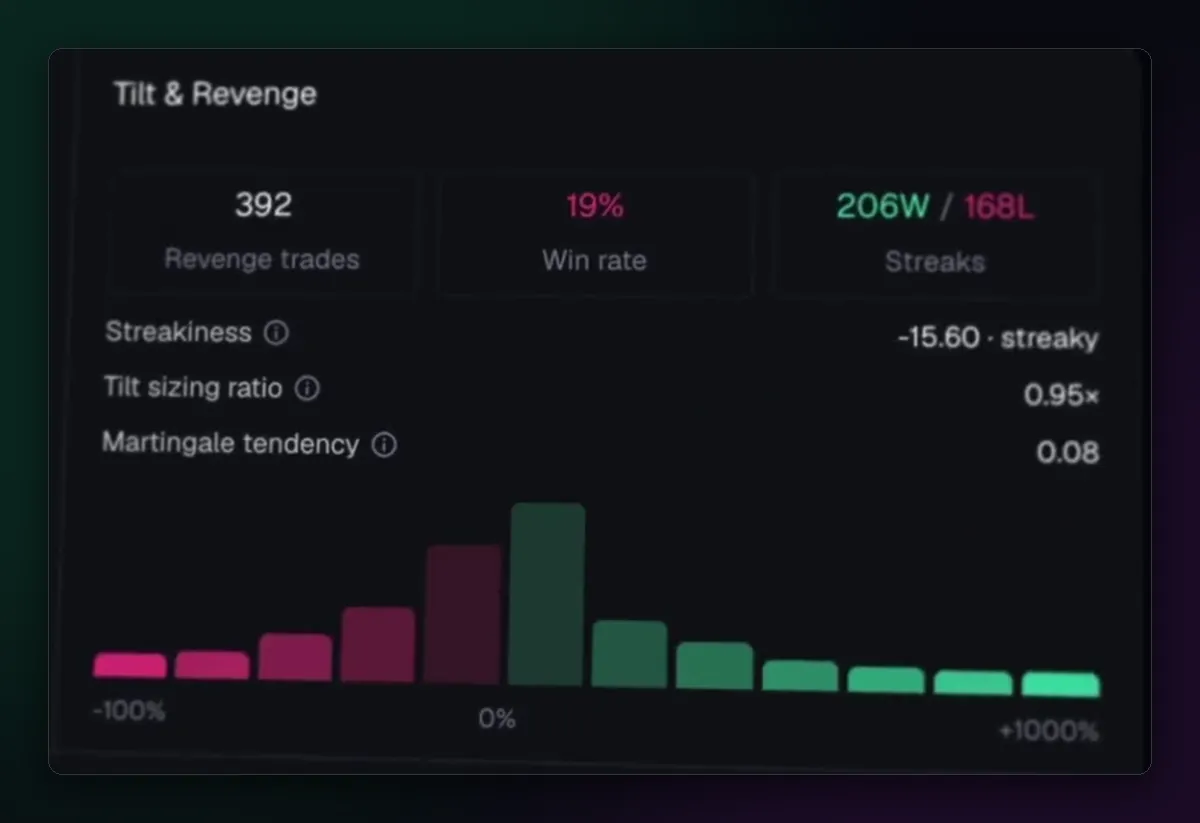
Since August 2026 the portfolio also reads your habits back to you. Degen Hours colours each hour of the week by result. Edge names your best and worst hold time and trade size. Tilt & Revenge counts revenge trades and how your size changes after a loss, and a compare view sets your numbers beside another trader's. Open Tilt & Revenge after a bad week before anything else. Every panel is listed on the portfolio tracker page.

Written by Mohammad Shahpari · Web3 CMO, Crypto Growth & SEO Specialist · X · LinkedIn
Did this answer your question?