
How to Read Holder, Dev and Bundle Data
Every token page on Axiom shows who holds the coin: the top 10, the developer, snipers, insiders and bundled wallets, plus maps of how those wallets connect. Five minutes with these numbers avoids most obvious traps.
 Updated November 10, 2026
On this page
The Token Info block
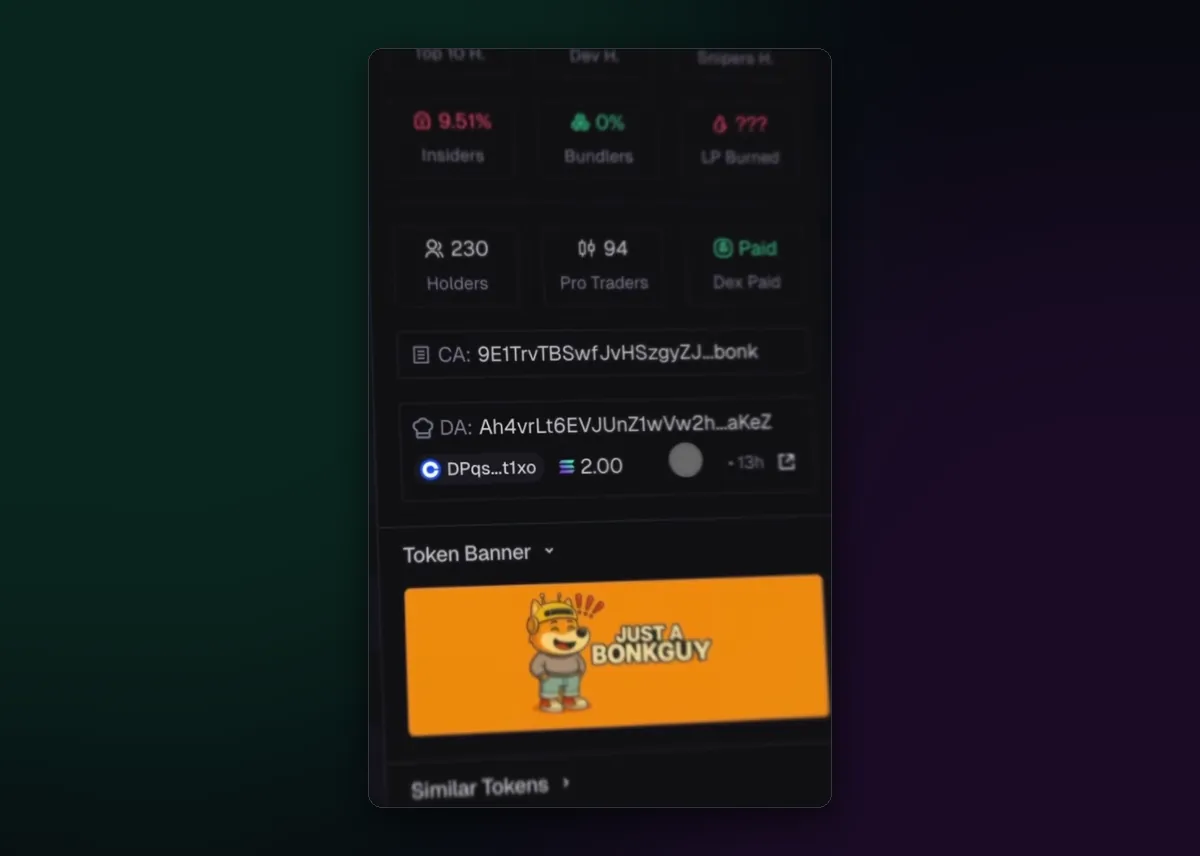
Under the order panel sits Token Info. The top row gives three shares of supply: top 10 holders, dev holding and snipers. The next gives insiders, bundlers and whether the liquidity is burned. Then come the number of holders, how many of them are pro traders, and whether the project paid for a DEX listing. Below that are the contract address and the developer's address.
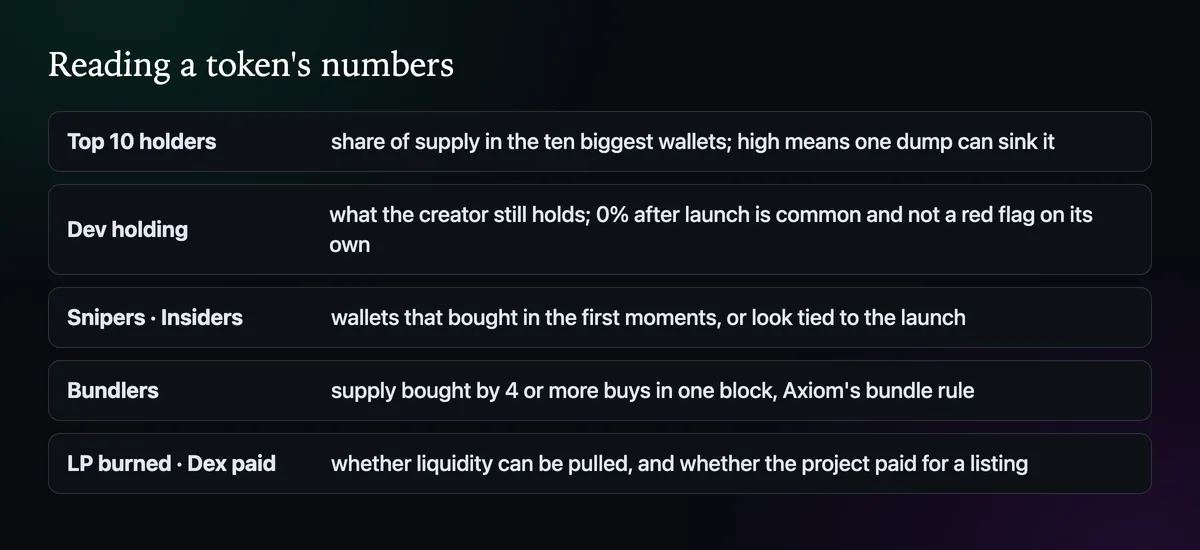
Follow the developer's money
The DA line shows the developer's wallet and, beneath it, the wallet that funded it, with how much SOL it sent and how long ago. Hover it and Axiom offers to open that funding wallet on Solscan. A dev funded straight from an exchange an hour before launch tells you less than one funded by a wallet that has launched twenty dead coins this week. The pattern matters more than any single number.
How Axiom flags bundles
A bundle is several buys landing in the same block, usually one person spreading a large purchase over many wallets. Axiom's rule is specific: four or more transactions in the same block count as a potential bundle, and a wallet is dropped from the count if its next transaction isn't bundled too. That is why its bundle figure can differ from other tools, which often only look at the first blocks after launch. A high bundle share means a lot of supply can be sold at once.
See the holders as a map
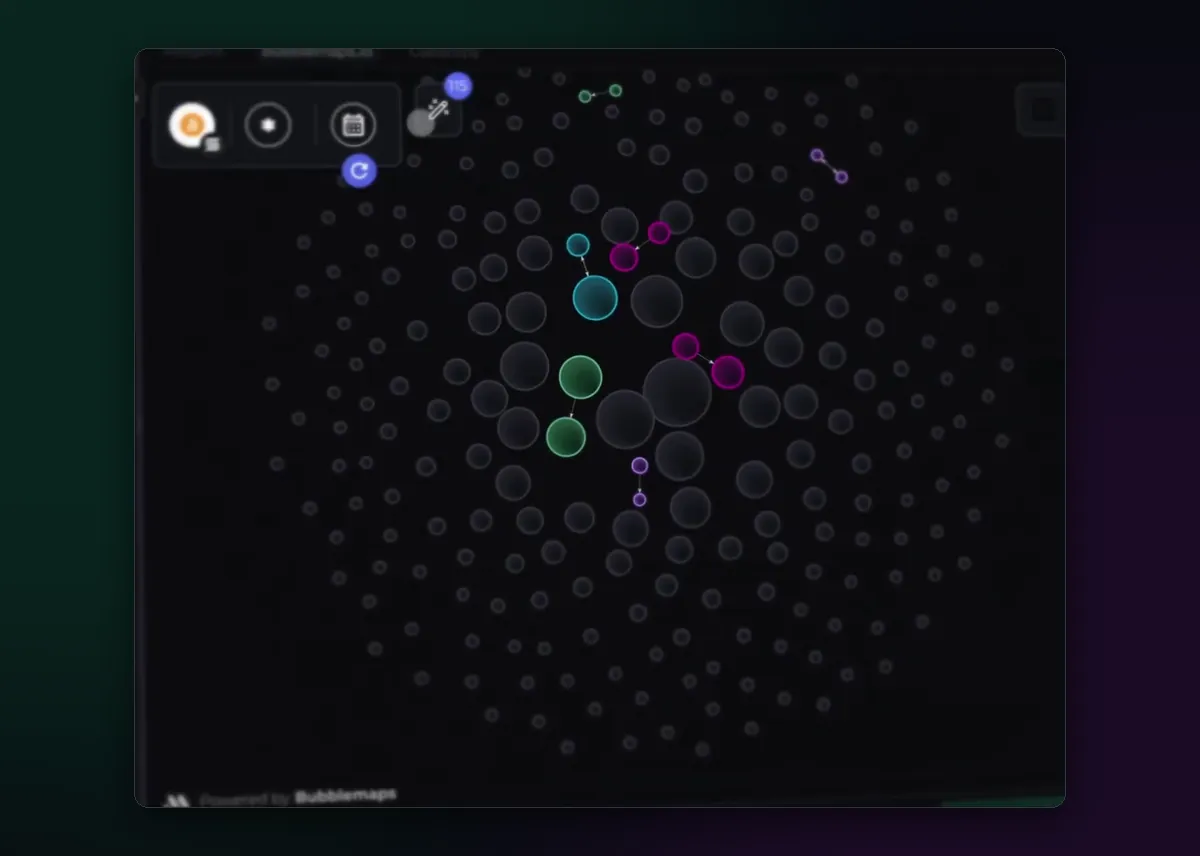
The holders panel can show a bubble map instead of a list: each wallet is a circle sized by what it holds, and lines join wallets that sent each other funds. A cluster of linked bubbles is one person or group, however many wallets they use. Since May 2026, Atlas maps from InsightX add a live view and a historical one, so you can watch clusters form during the day.
Holder lines on the chart
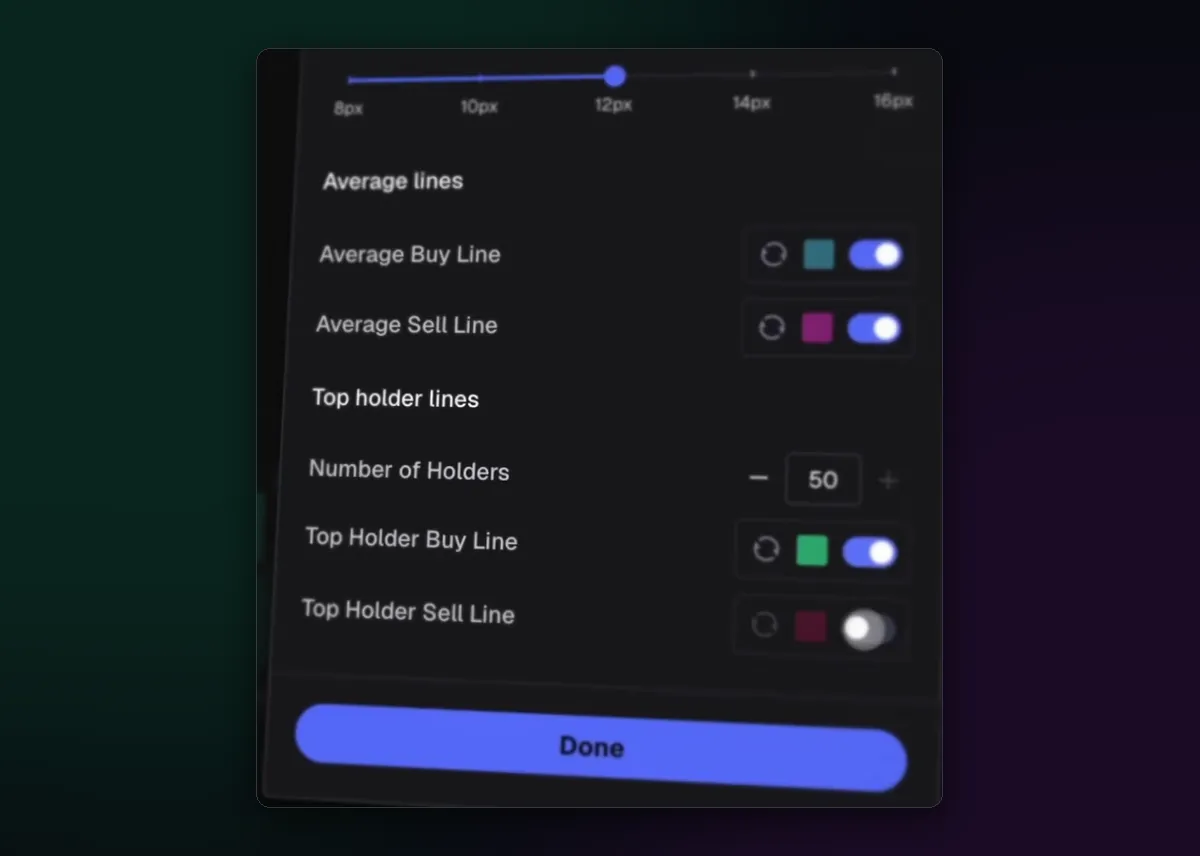
In the chart settings you can draw your average buy and sell prices, and the average entry and exit of the top holders, as lines across the chart. When the price sits far above where the biggest holders bought, they are sitting on profit they can take at any moment. The token scanner page goes further into using these checks together.

Written by Mohammad Shahpari · Web3 CMO, Crypto Growth & SEO Specialist · X · LinkedIn
Did this answer your question?