
How to Check Your Perps PnL and Trade History
Perps results on Axiom have their own portfolio, kept apart from spot, with all-time volume, total PnL and every closed trade. Here is where to find them, how to read an open position, and why funding can move your result without a single trade.
 Updated November 18, 2026
On this page
Portfolio, then Perpetuals
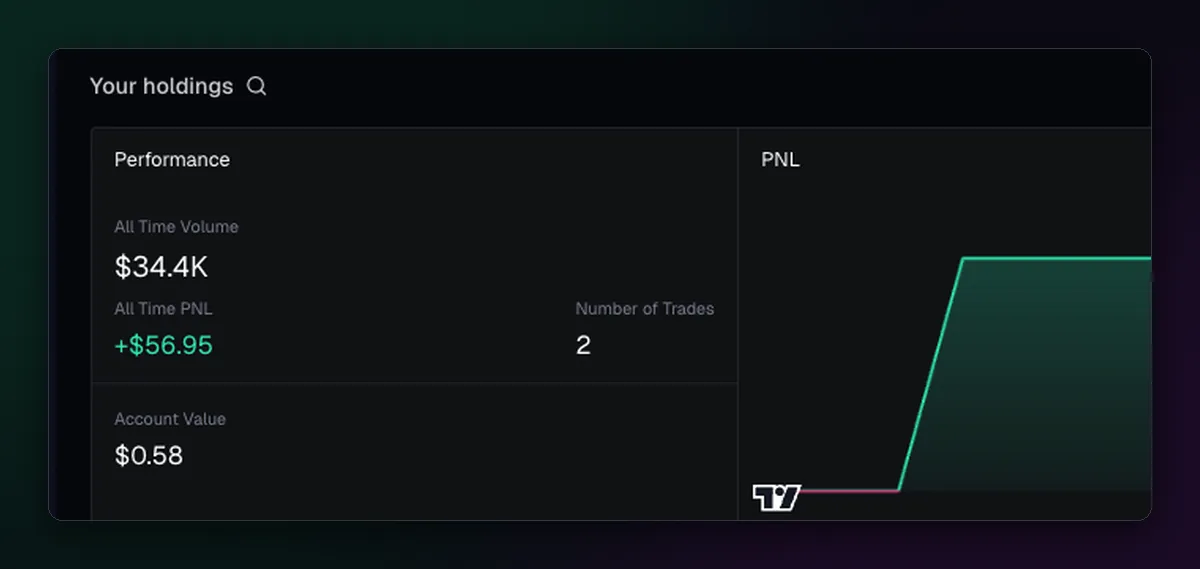
Open Portfolio from the top bar and switch to Perpetuals. Performance shows your all-time volume, all-time PnL and the number of trades, and Account Value is what the perps balance is worth right now, open positions included. The PnL chart beside it follows the 7d, 30d or Max switch. Axiom keeps this apart from spot on purpose, so a good month of memecoins cannot hide a bad month of leverage, or the other way round.
Reading an open position
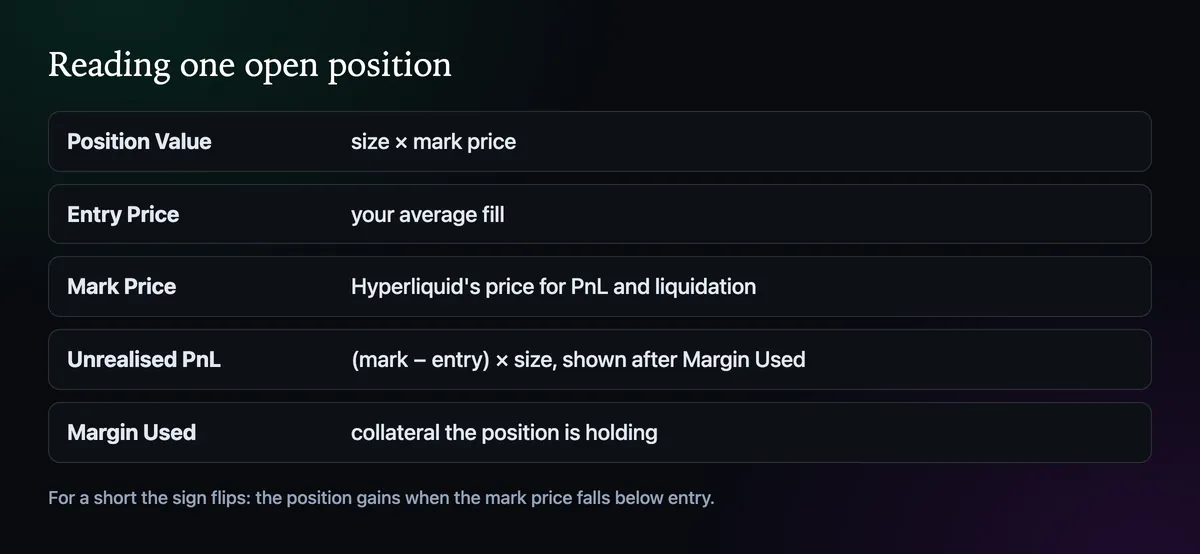
Position is the size and direction. Position Value is that size at the mark price. Entry Price is your average fill, and Mark Price is the price Hyperliquid uses for PnL and for liquidation. The gap between the two, times the size, is your unrealised PnL, shown in brackets after Margin Used, the collateral the position is holding. Keep an eye on how far Mark Price sits from the Liquidation Price column, which How Leverage and Liquidation Price Work on Axiom explains.
Trade History and the Trades tab
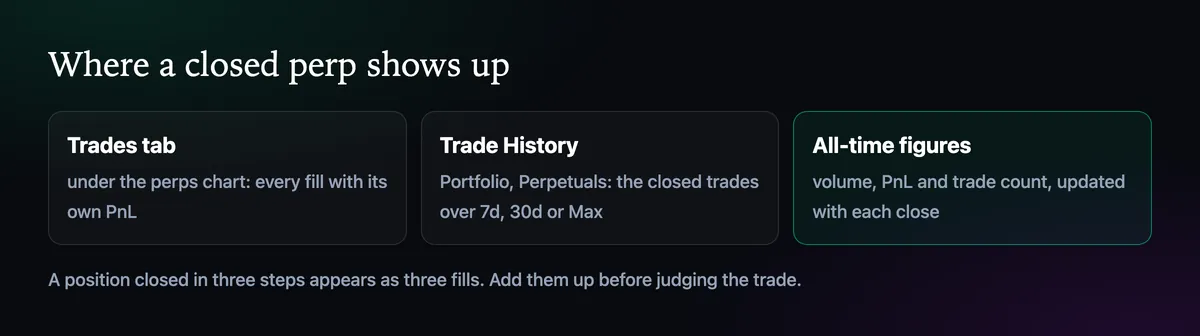
Closed trades land in two places: Trade History on the Perpetuals portfolio, and the Trades tab under the perps chart, where each fill shows with its own PnL. Partial closes appear as separate fills, so a trade you exited in three steps shows up three times. Add them up before you judge the trade.
Funding moves the number too
Perps pay funding between longs and shorts on a fixed rhythm, and the perps header shows the current rate and a countdown to the next payment. It changes your account value without any trade appearing in the history, so a position held for days can show a different PnL from the one its price chart suggests. Fees work the same way; How to Deposit USDC for Perps lists what each step costs.

Written by Mohammad Shahpari · Web3 CMO, Crypto Growth & SEO Specialist · X · LinkedIn
Did this answer your question?