
How to Use the Chart and TradingView Tools on Axiom
Every token page on Axiom opens on a TradingView chart. The toolbar above it sets the candle interval, adds indicators and switches between price and market cap, and the column down the left holds the drawing tools. Here is what each part does and the three settings worth changing first.
 Updated November 16, 2026
On this page
The toolbar, left to right

The first button is the interval, and Axiom goes down to one-second candles, which matter on a launch that is three minutes old. Next come the candle style, Indicators and Display Options. In the middle are two switches, USD or the chain's own coin, and MarketCap or Price. On the right you can undo and redo drawings, save the layout, open chart settings, go full screen and take a snapshot.
Market cap or price, dollars or coins
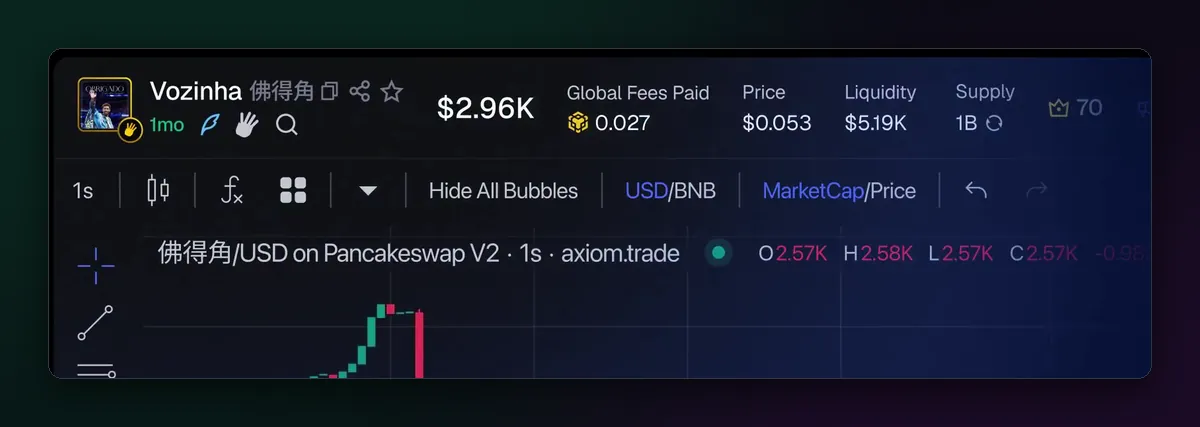
Most memecoin traders read the chart in market cap, because a price of $0.000041 says nothing while $41K says a lot. Switch to Price when you compare with an exchange listing. The coin switch follows the chain you are on: SOL on Solana, BNB on BNB Chain, ETH on Base. The same toolbar has Hide All Bubbles, which clears the small avatar markers that can sit on the candles when the chart gets crowded.
Drawing on the chart
The column on the left holds the drawing tools: a crosshair, trend lines, horizontal levels, shapes, text, a ruler for measuring a move, and at the bottom a lock and a bin. Horizontal levels are the most useful on young tokens; mark the launch price and the last two swing highs, and the rest of the chart reads faster. Limit orders appear here as well, as a line you can drag, which How to Place a Limit Order on Axiom covers.
Built on TradingView
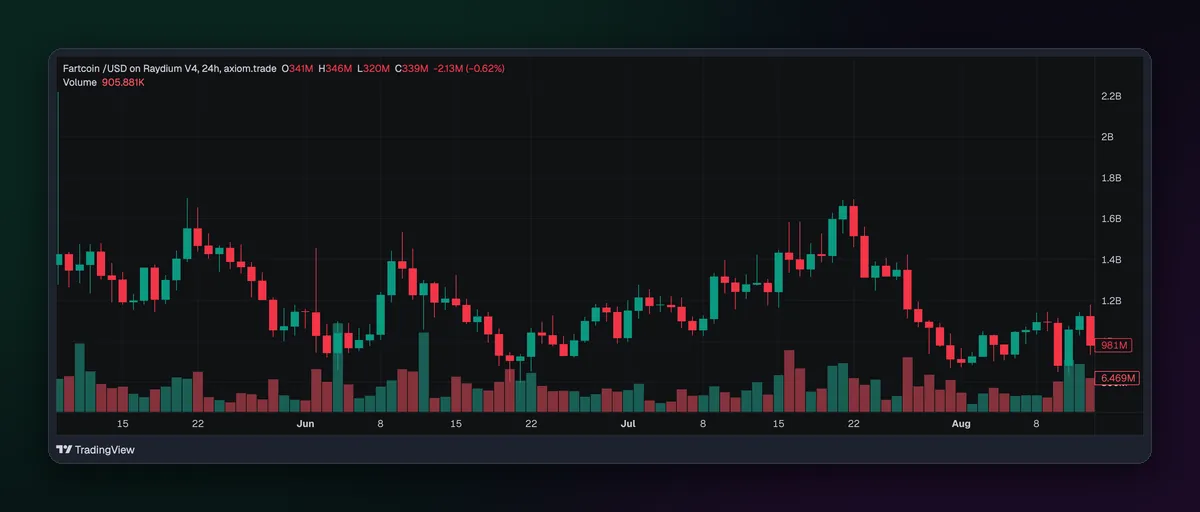
Axiom's charts come through its partnership with TradingView, so the indicator list is TradingView's: moving averages, RSI, VWAP and the rest, applied from the Indicators button. If you already use TradingView, the shortcuts and drawing behaviour will feel familiar.
Three settings to change first
- Set the interval to 1s for fresh launches and 1m or 5m for anything older than a day.
- Turn on MarketCap so levels match the numbers in Pulse and on the token page.
- Press Save once your layout looks right, so the next token opens the same way.
The data around the chart, holders, dev and bundles, is explained in How to Read Holder, Dev and Bundle Data.

Written by Mohammad Shahpari · Web3 CMO, Crypto Growth & SEO Specialist · X · LinkedIn
Did this answer your question?